Database
SmartBioGraphDatabase (SmartBioGraphDB) is a heterogeneous integrated graph database running on Neo4J
(https://neo4j.com). Its main data source is CROssBAR-DB,
which is an integrated biological document-oriented database
(https://liverdb.kansil.org/crossbar).
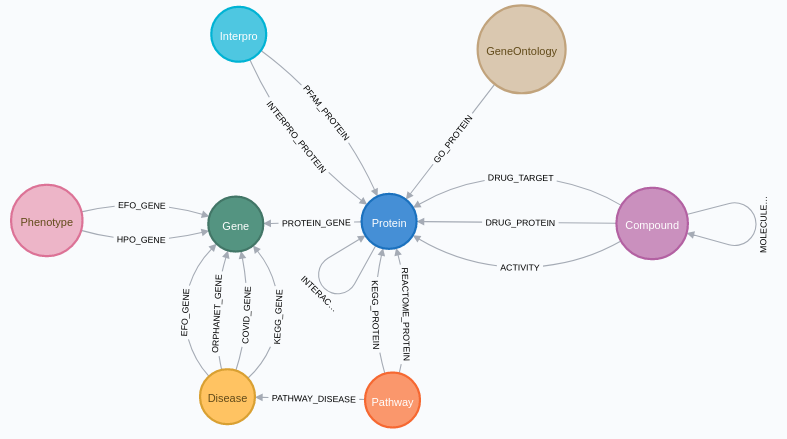
Through CROssBAR-DB, data from UniProtKB, InterPro, DrugBank, ChEMBL, Reactome, OMIM, Orphanet,
Experimental Factor Ontology (EFO) and Human Phenotype Ontology (HPO) is integrated to SmartBioGraphDB.
In addition to these resources form CROssBAR-DB,
data from KEGG database is acquired. Moreover, relationships
are added through UniProtKB's SARS-CoV-2 proteins and receptors
page (https://covid-19.uniprot.org) for Covid-19 disease.
Monthly automated periodic update is implemented for SmartBioGraphDB.

Web Application and Features
SmartBioSearch Interface is a web application for querying and visualisation of SmartBioGraphDB. The technologies used in the application are Python, Django, Nginx, JavaScript, jQuery and CytoScape. Web application's main features can be described as follows: Querying with user interface, filtering based on statistical enrichment analysis and visualisation.
Querying with UI
The goal of querying with UI in our web application is to provide access to the database without having
to write queries in Cypher Query Language (CQL). This way, the database is accessible for users who do
not have background in query languages. In the UI, there are two distinct functionalities for users to
query the database: Node Search and Graph Search. Both of the functionalities do not
require any query language knowledge.
There are two parameters that can be used while querying the database. The first parameter is whether
unreviewed proteins are to be included or not. This way, users can opt to filter out TrEMBL part of the
UniProKB and to use only Swiss-Prot data. The second parameter is about selecting the organisms of
proteins to be included. For this, user provides a list of taxonomy ID's. Node search requires an
additional parameter whether to include or not inactive relationships between compounds and proteins
from ChEMBL database according to their pChEMBL values. If pChEMBL value is greater than 5
(i.e. XC50 > 10 uM), we label the relationship as active and otherwise as inactive. 5 was chosen
as the threshold, since it represents the possibility for active binding and this value is commonly
used in the literature (Rifaioglu et al., 2020). The default is to return only the active relationships
in graph search. If there are multiple reported pChEMBL values for a compound-protein pair, their
median is taken into account.
Graph Search
Graph Search is a more complex and novel functionality than the node
search. It uses the flexibility of graph database technology and it is simply
not feasible to implement for a relational database. To our knowledge, there
is no similar functionality design to graph search in any other database.
The user begins by providing a label and a property of a node that
makes up the root node. The user, then, constructs a search tree by adding
nodes that are adjacent to the given root node. This may continue by
adding nodes to the tree of height up to five, due to bounded computational
resources. The resulting graph is subsequently constructed with multiple
optimized queries which are constructed by using breadth-first traversal
on the input tree. The graph is filtered based on the statistical enrichment
analysis during the execution of the queries to be able to visualise
result.
Graph search is located at the bottom bar under the “Graph Search” tab. User should
fill node identifier coherent with node type and field. After clicking "Add Source" button the main node will appear.
User can now left click any node on the screen and keep adding new node types by checking the checkboxes
under the "Graph Search" tab and clicking "Add Path" button.
After creating desired topology you can get the resulting graph by clicking "Search" button.
This operation may take time.
Clicking the "Reset" button will reset the topology or delete the graph.
Node Search
Node Search is a simple functionality designed to explore a single node in
the database. The user queries the database for a node of their choice by
providing one of the nine labels and a value of one of its properties. The
application, then, translates this user input into a query in Cypher Query
Language, retrieves only the specified node with the nodes adjacent to it,
and renders the result. For example, if the node of interest is the gene with
symbol TP53, then "gene" as a node label with the symbol "TP53" as a
property are provided by the user.
Node search is located at the bottom bar under the “Node Search” tab.
User should fill node identifier coherent with node type and field.
After clicking "Search" button the searched node will appear along with its
first degree neighbors.
Filtering based on Statistical Enrichment Analysis
The result of a graph search query typically contains too many nodes and relationships to visualize,
ranging from thousands to hundreds of thousands. Therefore, filtering based on enrichment analysis
is performed as the graph is being constructed. The goal of the enrichment analysis is to remove
the less relevant nodes from the visualised graph. This analysis is adapted from CROssBAR-WS, as
it proved useful in filtering of similar knowledge graphs in CROssBAR-WS.
For every node v in the graph (except drug candidates), p-value
and enrichment score of Q is calculated as in Equations 1 and 2, respectively.
In these equations, m is the number of resulting graph proteins or genes that node v is connected
to, n is the total number of proteins or genes in the resulting graph, M is the number of total
proteins or genes that node v is connected to in the database and N is the total number of
proteins or genes in the database. If node v is connected to proteins in the database schema,
then the figures are calculated with respect to proteins. Otherwise, they are calculated with
respect to genes.
For the drug candidate nodes, enrichment score calculation is different. For these nodes, we label bioactivity data based on "pchembl" values stored in relationships between them and protein nodes. A pchembl value greater than or equal to 5 is labeled as active and a pchembl value less than 5 is labeled as inactive. If there are multiple bioactivity value for the same drug candidate-protein pair, the medians of their pchembl values are calculated and the pair is labeled as active or inactive based on this median value. Then, for every drug candidate node v, p-value and enrichment score of Q is calculated as in Equations 3 and 2, respectively. In these equations, m is the number of proteins that are labelled as active for drug candidate v, n is the total number of proteins in the resulting graph, M is the total number of proteins that are labelled as active for drug candidate v in the database, N is the total number of proteins that are labelled as active or inactive for drug candidate v in the database and Nuniverse is the number of proteins that have bioactivity data in the database.
After calculating p-value and enrichment score of Q for every node in the resulting graph, by default, a maximum of 30 nodes having p-value < 0.05 and the highest enrichment score for each node type (except the compound nodes that are not drugs) are shown in the resulting graph. For the compound nodes that are not drugs, a maximum of 5 nodes per protein, having the best enrichment scores and p-value < 0.05, are shown. The filtering parameters, namely p-value threshold, maximum node count per node type and maximum compounds per protein can be configured by the user.
Visualisation
The visualisation feature consists of two parts. The first is graph visualisation window based on CytoScape. This window is used to visualise resulting graphs of user queries. We provide a custom concentric graph layout that is configurable by the user. A few third-party layout options are also available. The graph visualisation window is interactive with the following options: delete node, display node details, and go to data source website. The second part of visualisation feature is the property display window. When the user clicks on a node on the graph visualisation window, that node's properties are displayed as a table on the screen. Similarly, if the user clicks on a relationship between two nodes, the properties of all the relationships between those nodes are displayed. A click action on a node or a relationship generates a query to the database in order to extract the related properties. The properties that are cross-references to other databases contain hyperlinks to the pages in related databases. The visualised data can be downloaded in PNG image format and in JSON format, which can be imported to CytoScape desktop application or used by other means.